
In total there were 30 sessions that made up TransportCamp 2017. Below is how the final agenda finished up.
2017 Sessions
In total, there were 30 fantastic TransportCamp sessions. Session notes were taken for each unconference session. Each post includes all the essential session details, links and a summary of all the key points of discussion.
Comments are enabled, so feel free to continue the conversation in the post or contact the session leader directly.
Stay tuned on Twitter for all the latest updates!
Parking Can Be Fun
Session details:
- Host name: Nikki Eylon from ParKam
- Room: Portico
- Format: Brief Presentation, then Q&A
- No. of attendees:14
- Scribe: Matthew Diemer

What does ParKam do?
ParKam uses CCTV cameras and other technology to analyse a parking area and provide app users information and navigation to available parking spaces.
The data is also sent to on-site parking information signs which shows the number of spaces available.
Data on usage can inform how to better utilise the parking area. Example of guiding car to specific spaces based on size of car.
How does it work?
App automatically diverts users away from streets that are at capacity, or will soon be at capacity, based on the number of people currently looking for spaces.
App allows for preferences such as parking distance from destination. Drivers can tell the app if they are willing to walk further for a cheaper space.
ParKam’s technology can be utilised to implement dynamic pricing schemes more cheaply than putting sensors in each space.
Can team up with public transport agencies to provide parking navigation at PT stations and give real time info on train arrival times within the same app to create a holistic approach.
Discussion
Should dynamic pricing be able to create a fairer system, whereby users are paying for what they receive instead of taxpayers funding car parking subsidies as a “public good”?
Why are activity centres so bad for walking?
Session Details
Host name: Duane Burtt
Room: Regent
Format: Workshop, Presentation and Discussion
No. of attendees: 18
Scribe: Tim Hays

Identified Issues
Poor walkability between shopping centres and nearby residential areas.
High risk of crossing busy roads.
Activity centres are designed to accommodate cars rather than pedestrians.
Planning schemes don’t address if activity centres are for pedestrians or cars.
Already tried and failed solutions
To build corner shops on key location sites to increase street vitality.
Stakeholders desired outcomes
Developers prefer car parking underneath their shops rather than outside.
Discussion about potential solutions
Shift to make active transport come first in the planning process rather than prioritising building development first.
Councils focus too much on single storey land use rather than mixed use.
Public Transport Network Knowledge & Thinking
Session Details
Host: Peter Parker from Network Planner, Western Metropolitan, Transport for Victoria
Room: Yarra
Format: Presentation
No. of attendees: 25
Scribe: James Reynolds
Public Transport Analogy
Public transport has similarity to a gate from your residence onto the street that opens only once every x minutes. If the gate opens every 60 minutes then it is very inconvenient, and it is difficult to leave your house. Similarly for a 60 minute frequency transit service. However, if the gate opens every 2 minutes (a very frequent transit service), then it is not really an inconvenience.
What is the issue with public transit systems?
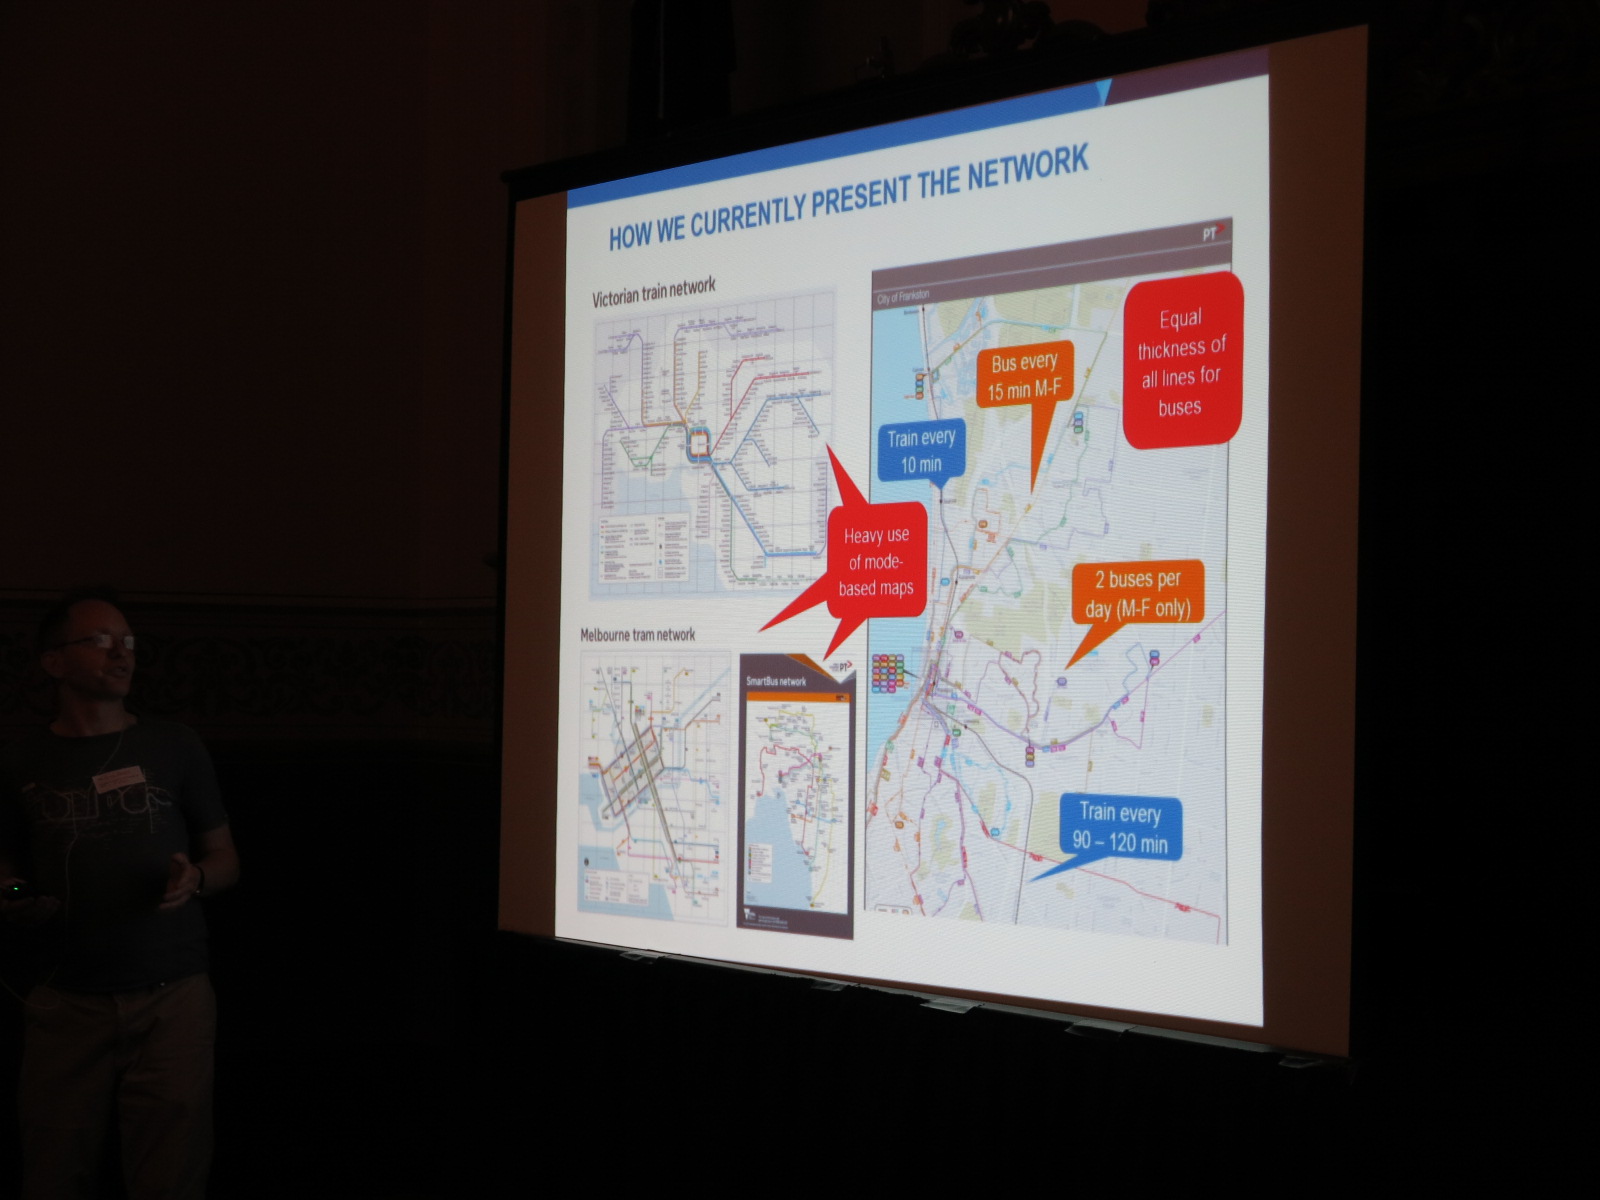
Public transit system maps typically show routes, not frequency. For example, the transit map for Frankston shows a route with 2 services a day in the same line time as a Smart Bus service with services every 10-20 minutes.
What is the current transit system in Melbourne?
Visualising the Melbourne transit routes that have headways of 10 minutes or less (turn up and go) shows:
Much of the tram network
CBD to Fankston, Dandenong, City loop, Footscray and Newport on the train network
Selected bus routes (ie Monash 601 shuttle)
It is a limited network, and passengers must interchange in the city.
How could the public transport system be improved?
Visualising the Melbourne transit network routes that have headways of 15 minutes or less (weekdays) adds:
- Trains to ringwood and Sandringham
- Smartbus routes
- All of the tram network
The network covers all of the inner areas, much of the middle suburbs and includes both radial services (tram and train) and crosstown Smartbus routes.
Thinking about the transit network in terms of frequency may provide a better communication tool than traditional maps separated by mode (eg. current train, tram and bus network maps). This could improve public’s ability to understand where they can get to easily on the network, particularly on bus services.
Which parts of Melbourne have a 20 minute network?
The 20 minute network (check timetable, but still fairly frequent) covers most of the train network (notable exceptions Lillydale and Belgrave), the tram network, SmartBus network and various local bus routes.
New minimum standards for bus routes and new approaches in the last couple of years adopts some of this approach, by seeking to provide a 20 minute network, as well as into the evenings. Recent service upgrades have also sought to harmonise the bus and train frequencies, particular in outer areas.
Conclusions
- “Service levels are key to useful public transport
- Think of the network in terms of service, not just infrastructure
- Start by building your mental map of network service levels
Look at route maps at ptv.vic.gov.au
Look at timetables, noting hours and frequencies”
Question and Answer Session
Nick from Melbourne City Council: Will people really make a change from the car to (bus based) transit based on better mapping? Or is it more that trams are more popular because of the tram tracker app, ease of travel, better services?
Response: Something like a map is a way of taking the mystery out of the bus network, and increase the general public knowledge of (higher frequency) bus routes.
Bridget from the City of Casey: A lot of green field development in the outer areas has little to no bus service. Is it better to focus on coverage (social access) vs frequency?
Response: This is a challenge for bus planning, and we would end up with very different networks if we focused on either one or the other. This is a larger choice for society and the answer is somewhere in between, with a mix of objectives to balance access and frequency.
Carl from the City of Ballarat: is it to do with trams and trains having fixed infrastructure, giving passengers confidence about where the transit service is (and will stay)?
Response: Some ways of increasing physical presence of bus routes, ie. SmartBus branding at stops. Other examples (from room) include the MUNI bus system in San Francisco.
Chris Loader from TFV: comment about tram apps - the PTV app gives realtime information for all modes. There’s a distinction between journey planner app information (how do I get there now!) vs the consistent frequency network of how they can get around in their network.
Ian Hopkins from Yarra trams: comment about how network analysis has shown that one of the best things to do for the tram network would be to increase frequencies on perpendicular bus routes. And that there are many more interchanges between public transport (ie. on the street) than we typically consider (ie. major infrastructure projects).
Successful Carpooling for Staff
Session Details
Room: Melbourne
Format: Discussion
No. of attendees:11
Host name: Kathleen Petras
Scribe: Samithree Rajapaksha

What's the idea?
As a remedy to less car park capacity and to contribute to a cleaner environment, Banyule City Council has developed and implemented a carpooling system among the staff members.
What was the focus?
The benefits to employees and to the community
How to initiate a carpooling system like by investigating how it could work best for the organisation
- How can people encourage to participate in car sharing
- How to maintain the program
Survey conducted on:
The current modes of staff transport, particularly the proportion of staff currently driving alone
Followed up by a discussion about the attitude towards carpooling and whether staff would be happy to travel together.
Potential issue and solution
One of the critical barriers to implementing a carpooling system, is a sudden conflict in leaving time of the employees who shared the car. As a solution for this they compensate the employees by providing a taxi fare for their trip.
Bike Data
Session Details
Room: Supper A
Format: General discussion
No. of attendees: 28
Host name: Luke Poland
Scribe: Sarah Roberts

What are the issues surrounding data use?
There are so many ways of collecting data on who is riding where, but we currently don’t know the bigger picture.
Sharing data is hard to do due to privacy issues.
How do other people in the bike space collect and share data?
Use it to make investments, turn data collection into information that can advocate for things.
Counting bike users can give you a snapshot, time sampling data is also important as it allows predictions to be made over a particular day.
How do you get data, how are you going to use this data?
- Vicroads- bike trials improve the culture. Looking at timed data at particular regions.
- Next step, can we use data from bike sharing companies like obike mobike or blue bikes?
Can we use data from bike sharing companies like Obike MoBike or Blue Bikes?
There is a Victorian bike data and vicroads portal that is open and includes this type of data.
Other cities focus on sharing their data- We need to have this type of stance here in Australia.
Data that tells us where people are, where they are travelling and what facilities they are using is helpful.
(PTV) We don’t have the data on facilities and bikes at this stage, but we are working on it with Monash.
Bikes often don’t have mechanisms to collect data, but bike sharing does.
There is no one report saying what is actually going on with bike travel, this is because it covers multiple sectors of government.
We need to develop a single way of collecting data and an overview so that everyone can use it
Who should do this? Different organisations have different focuses and will therefore target different areas.
Limitations
There are limitations with the blue bike docking systems. You need density, bike racks (the cost of implementing these are high though). Dockless bikes currently have the advantage.
MoBike
They are a technology company, that uses smart locks, connected via simcards and the internet.
Mobike constantly monitors where each of their bikes are.
They need to know where their users are so their bikes can be moved closer to them.
They need data so they can see where people are and make infrastructure investments accordingly.
Their focus is on Transport, City planning (using their data to improve the city for bike riding, walking and PT use), Social (help people in deprived areas move).
- You can’t use movement data with personal data by law. They use opt-in surveys as a way around this.
Question: Sharing this data with city and local councils, would you sell this data?
Response: No, they share their data with cities when they are the sole operator within those cities.
What do we need to know?
We need to understand why people ride, where they ride, where the gaps are and how it links with PT
Hard to beat the train with the bike. This is not true (covered in another session).How are the trips linked together?
How are the trips linked together?
The bike is part of the network and we need to start thinking of them this way.
We need to understand the people who don’t ride as well. People who do ride gives us an understanding but we need to build up the system more. There is currently not enough data on why people don’t ride bikes.
- Mobike, sees this in the opposite, China has more people riding Mobike than taxis. It is about the first mile and last mile connections.
Things to consider
We can’t be reliant on bike sharing data as personal bikes are used differently and are more common.
Everyone wants the data but no one is willing to invest in it and then release it.
Question: What are people doing overseas?
Response: Transport for London, has a list of statistics, facts, what they are doing, trends, and a report on the objectives that they have achieved. We don’t do this in Melbourne, but we need to start creating this foundation.
We could possibly build off the census data
We need to know what we are using this data for, why we are collecting it, who needs it, how we share it, how we use it, and what the future will look like.
Need to find out how do people use bikes? How can bikes be used in other ways. Bikes as health, and a community active.
Developing a networked public transport city, cyclable city of cities and regional hubs.
Session Details
Room: Portico
Format: Discussion session
Host name: Jackie Fristacky
Your name: James Reynolds

How does Melbourne's public transport system reflect the city?
Melbourne has a radial train network, with a limit crosstown connections outside the inner areas. The network is predominantly focused on the centre of Melbourne. Reflective of a ‘view’ that the jobs in the centre of Melbourne are the most important, but is this really the case?
How can we change this?
Challenge is to develop a true network across the Melbourne area, which allows connections across the city. This ties in with the activity centres concept from Plan Melbourne and other larger scale planning documents.
Where do we go? Do we seek to use light rail? Improve buses?
- Improving links across Sunshine and to Melbourne Airport.
- Peter Langtree from Queen Victoria Market: use express bus corridors (central lane) to a hub at the Queen Victoria Market and out to the west.
- Links through Monash University, Doncaster, Broadmeadows to the airport
- Les from Yarra Trams: how do we get some of these ideas onto the planning agenda. Problem that Melbourne Metro will suck up a lot of funding. There’s a lack of a transport plan.
- Jackie Fristacky: The lack of central planning is a problem, and telling that the City of Melbourne is now looking at going ahead with its own plan. Funding is an issue.
- James Reynolds: Potential for bike share systems to provide cross-town links across town.
- Peter Langtree: lack of forward planning is a major problem.
- Brendan Pender from Phillip Boyle and Associates: problem of risk averse government, and the need for no-losers and cost-neutral change. For example the Deakin-Burwood to Box Hill, route 201, poorly resourced, but there are buses elsewhere on the network.
- Mike from Duncan solutions: Dedicated lanes for shuttle between satellite parking and city.
- Michael from RACV: Continuing on from bike share corridors, also consider using car share to support station access. Potential to have councils give approval at train stations and have approvals to have car share spots in estates.
- Ben Murphy from Phillip Boyle and Associates: problems associated with car share systems is that they require a round trip. Lots of capacity in the counter peak direction, and Melbourne perhaps doesn’t celebrate it’s existing orbital bus network.
What does the census tell us about population density, population growth, motor vehicle ownership, and dwelling occupancy in Melbourne and other Australian cities
Session Details
Room: Supper
Format: Presentation
No. of attendees: 30
Host name: Chris Loader
Scribe: Samithree Rajapaksha

What was discussed?
The trends in Population Density, Population Growth, Car Ownership and Dwelling Occupancy in Australia (Mainly focusses on Melbourne) over the past years.
Claimed that the default density calculation is misleading as low density areas of non urban land were included in calculation. Therefore suggests to calculate weighted densities instead of simple population density.
Findings:
Melbourne is only growing in higher densities not in lower densities
Density near CBD increasing rather than in outer suburbs
There’s a decline in the population in lower density areas over the past years.
In Melbourne Car ownership hasn’t increased at all.
In Melbourne there's significant decline in private dwelling occupancy level as well.
Designing Metro 3
Session Details
Room: Yarra
Format: Workshop
Host name: City of Melbourne
Scribe: Tim Hays

Assuming that Metro 2 is built, where will the line for Metro 3 will go?
Proposed objectives, with a wide consensus over all groups
Focusing metro 3 around western suburbs due to the higher levels of population and lack of current rail infrastructure.
Linking rail line between rail corridors identified as major problem to address (outer ring line).
Focus on inner North, Carlton etc. areas that will have job growth.
Avoid North Melbourne and CBD stations to relive bottleneck and congestion.
Less focus on the central city
Do you really need a car?
Session Details
Room: Melbourne
Format: Presentation & Discussion
No. of attendees: 9
Host name: Julie O’Brien (La Trobe Uni)
Your name: Matthew Diemer

Why do people choose the car over other modes of transport?
The practicality of having kids to drop off, shopping to do, makes alternative transport modes difficult for many people
The type of neighbourhood you live in can worsen the problem
Walkability and Accessibility in the neighbourhood makes a huge difference
Children seem to sometimes be used as a scapegoat for people who just prefer to use a car anyway. Many people without children are also very dependent on their cars.
A possible solution?
Services like car shares can allow people in more suburban neighbourhoods to live without their own car.
What kind of neighbourhood's do families want to live in?
Many families want to live in a neighbourhood that’s more walkable, but it’s also less affordable and might not be able to get a home with enough space for the whole family.
School buses potentially allow freedom for parents to make more sustainable mobility choices for their own travel, but aren’t as widely used in Australia as compared to countries like the US.
Factors that are involved when someone makes the decision that they don’t need a car:
High prevalence of low speed streets
Local shops, schools, other amenities that are easy to access by walk and bike
Frequent public transport options
High Quality Infrastructure that provides you with choices
Understanding why people move around
Session Details
Room: Regent
Format: Co design workshop
No. of attendees: 16
Host name: Ilya Fridman
Scribe: Sarah Roberts

The Game Board
Ilya’s research is on why people catch buses and how can we do that better.
Everyone gets an envelope and a sheet of paper (game board) and a deck of cards
Cards are based on the positive utility of travel. This is why people chose to be mobile and why they use a particular mode
These cards are based on literature findings, these findings are often broad and don’t help designers design and solve problems
These workshop normally include 4 to 6 people and the answers given are often honest and genuine.
- The participants need to place the town hall image in one corner of their game board, and the house image in another corner.
- Using the marker, draw a line between both points, representing the type of trip you took to here this morning.
- Think about the different types of mobility you used to get here, attach the form of transport you used along the journey at the points that you used them.
Have a look through the deck of cards you have been given, pick three cards and write a comment on how this relates to your journey, why you chose this mode, or something that this mode is lacking. Pin these cards to your journey.
If the mode you used wasn’t your ideal situation you can say you wish it was like this.
What do you want that was missing, reflect back on the trip, what could it have done better?
Everything is open to your interpretation
What were the group's findings?
- Dropped off at Train, walked. Dropped off safe. Train therapeutic compared to driving, less stressful. Walk more pleasant.
- Drove, walked. It is Friday can be more independent, countable to no one but self, you have control. This control was the biggest part of their decision.
- Car, drove, walked, tram. Seek control, didn’t want to be suck in traffic. Planning ahead, pick up car and then drive down cost. Had more time this morning. Independence, rather walk than rely on train
- Walk, train (normally cycle, but didn’t want to be sweaty). Wanted a bit of variety and adventure, use different routes, gets this from cycling
- Walked, train, walked. Walk for physical exercise, can distress, train is therapeutic. Trains late, don’t worry someone else is dealing with it. Environment exposure, see how other people are, rain sun, varies the environment.
- Drove (control, get off train and go home), Vline (safety, don’t want to drive back, exhausted), tram, (normally would walk, but tram was more convenient).
- Walk, Train station (train delayed, lost control), tram (good to people watch)
- Walk, tram, walk, for physical exercise, making ways to force walking, can get coffee, people watch, get sunshine, get here. Don’t need to do extra trip for car. Also for scenery, walking different ways each time
- Walked, bus, weaved through people because the bus didn’t arrive. Like frequency of the bus service, but don’t like waiting too long, or the unpredictability. Safety, the cycling routes can be dangerous and stressful. Likes being zoned out, but the bus is a little jerky, so train is better, Seeking therapeutic trip.
- Rode motorbike, but talking about bike, likes the sun and the outdoor experience. She is able to think, make to do lists. She has control and independence of it.
- Bike, Love being outside, offices are too boxy. The journey time is always the same, independence and control.
- Walk, tram, train, walk. Control, don’t like cars because don’t feel in control, people drive slow, PT and timetable gives him that control. Synergy, Myki, allows him to pay once between different modes. Walking and using timetable service, stops the worry about where to park, can’t park at train station unless you get there early.
- Don’t like crowded trains so drove in. Can leave or start when they want. Don’t mind traffic, gives him the freedom to go where he wants. New car so needs to be careful where to park, doesn’t like to drive in the city. Then caught the tram, couldn’t walk because of medical condition. Trams is great because it is free. And then walk. Safe because the tram is safe and didn’t have to walk
- Kiss and ride(station), train, walk. Sometimes need to take the bus instead of driving but doesn’t like that. 20 minutes to walk, walking in the arvo is fine but not in the morning. Would like to be independent and not rely on the lift or the bus, the bus is infrequent and doesn’t line up with the train, late or doesn’t arrive.
- Walk dropped suitcase off at office, walked a new street and a new route. Took a detour to get here so more walking.
- Walk, tram city, walked. Control, Only in Melbourne for a weeks but is anxious about using the PT. Uses google maps as a way of navigation.
The points that Ilya found interesting?
- How people saw control and therapeutic value with the different modes of transport.
- The way you drew your travel line was impacted by the mode you used.
- The stories, linking the transport to the story you told, and how it attracted you.
How transport influences your life, not just about the daily commute, but what is happening in your life. Today is Friday so the transport changes
- Kids also impact the way people travel.
Did anyone use a trip planning app to get to where they are going?
- Google maps (common), PTV app (a few people). Other possible apps PTV, trip go, city mapper, ways, tram tracker.
Bike Sharing and how to do it right?
Session Details
Room: Melbourne
Format: Discussion
No. of attendees:
Host name: Jayden from O-Bikes
Your name: James Reynolds

What can bike sharing achieve?
Bike sharing: convenient way of solving the last mile problem, increase active transport and provides health and environmental benefits etc.
Why would people ride a bicycle?
People tend to use the bike more for leisure in Australia, rather than for transport.
Why is this?
Significant safety concerns in Australia
Bicycling now has not yet been normalised in Melbourne.
Problems with quality of bike
Infrastructure problems in Melbourne.
- Eg Canning street bike lane ends
- Eg problem of parked vehicles in Swanston Street.
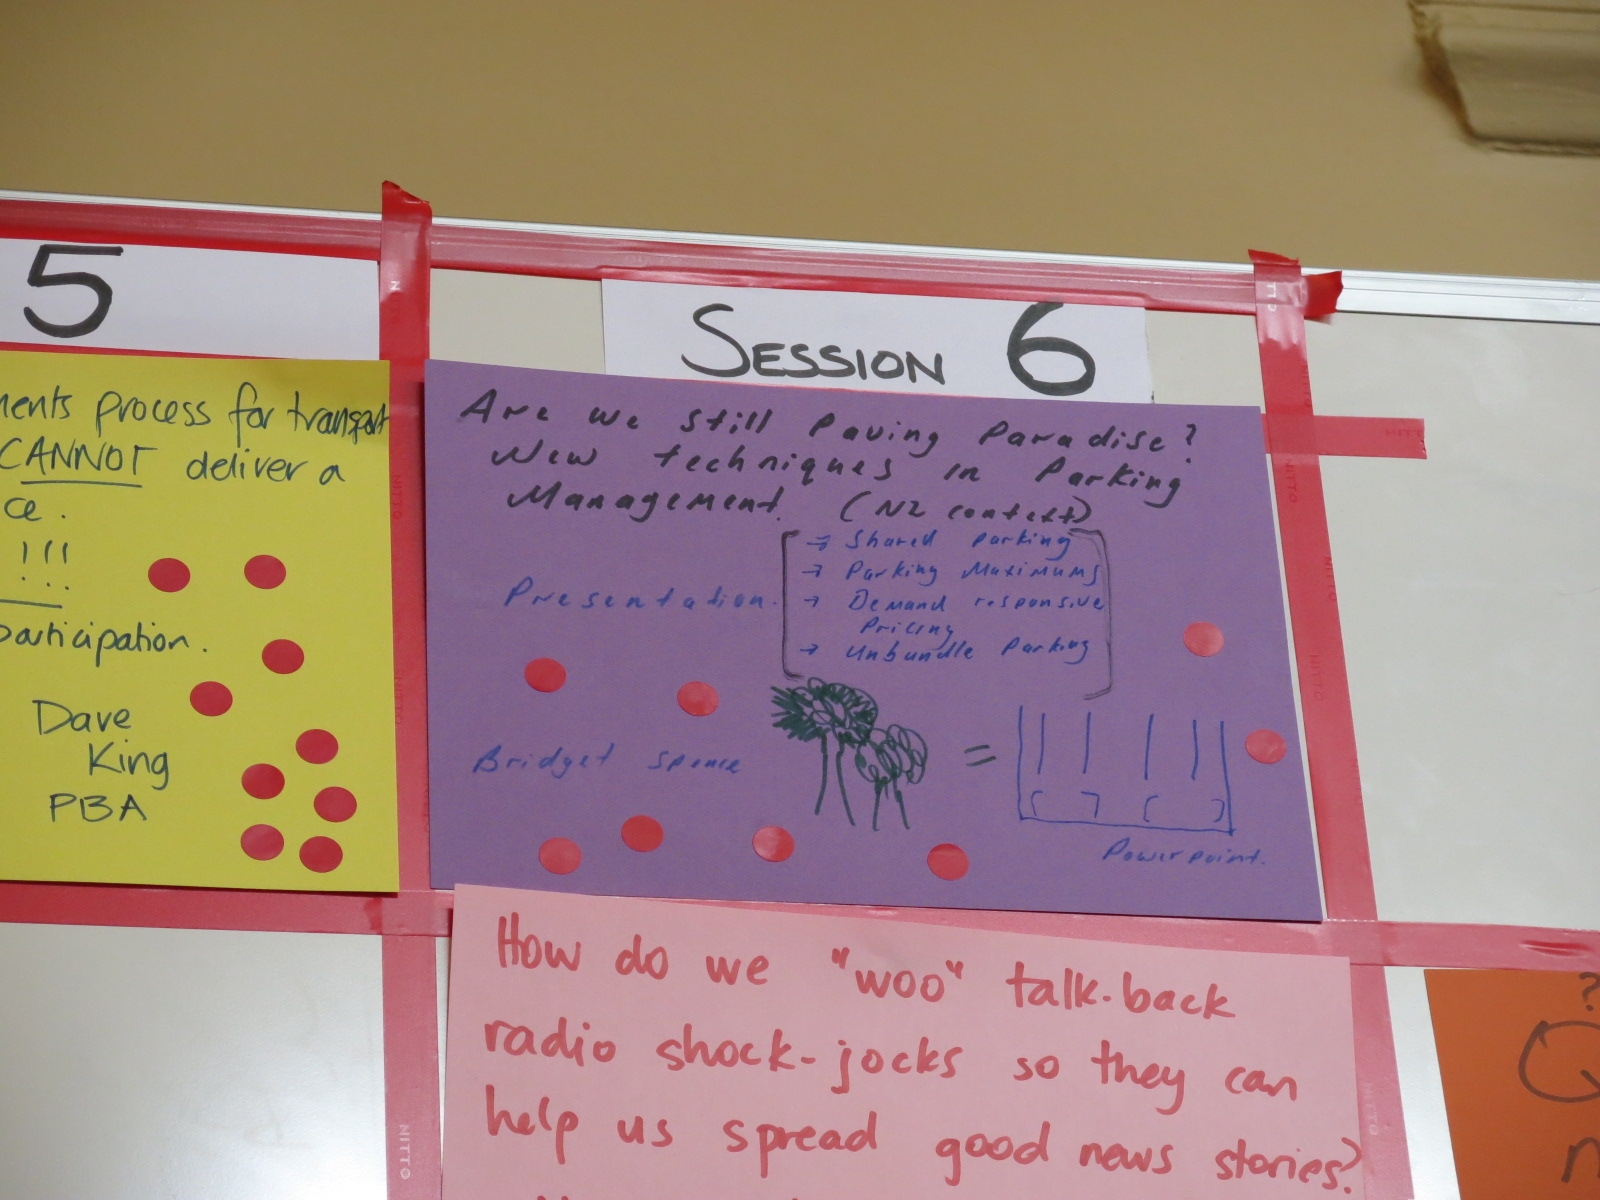
Are We Still Paving Paradise?
Session Details
Room: Regent
Format: Presentation & Discussion
No. of attendees: 8
Host name: Bridget Spence (Senior Sustainable Transport Planner, City of Casey)
Scribe: Matthew Diemer
What was the session about?
Parking as an integral part of the transport system that also plays a major role in the shape of our cities.
There is a lack of research and general guidance for those tasked with parking management.
The new parking management paradigm is attempting to gradually move away from the ‘predict and provide’ approach: new policies such as unbundled parking, parking maximums, and demand responsive pricing are leading this change.
Technology is also aiding in improved user information and guidance
Demand Responsive Parking:
- Cost is directly related to demand, resulting in more efficient usage
Facilities higher turnover rates while maintaining 85% occupancy
Pioneered by SFpark scheme in San Francisco, where it was found that the program resulted in a reduction in amount of parking infringements
High impact on efficient parking management
Most effective in areas where alternative modes of transport are available
Parking Maximums:
- Important conversation starter about parking supply
May be restrictive or may still result in an oversupply (particularly if maximums are set higher than actual demand)
Removal of parking minimums tends to be more effective than setting maximums
Is it justified to charge for parking in all areas? Knowledge of parking usage activity can help to make this judgement. Making assumptions without knowing the activities that are taking place can do more harm than good.
Technology is helping to make these more informed decisions
How to design a congestion charge for Melbourne
Room: Yarra
Format: Discussion
Host name: Will Fooks (GTA)
Scribe: Tim Hays

Applying London’s congestion charge in Melbourne
How would it work?
Motorists pay for roads at point of use.
Including political factors and current parking levy.
No exemptions for people living in the outer fringes.
Discount for disabled people outside the zones taxis etc.
Exemptions for emergency vehicles and car share schemes.
Charge freight in the name of efficiency to allow goods in and out for businesses daily operations.
No discount inside or outside the zone due to the availability of public transport in the CBD.
Disagreement on whether to apply it to the free tram zone or not.
Charge autonomous vehicles for the future, additional charge for no passengers.
Where does the revenue from this charge go?
Affordable housing.
Sustainable transport options such as bike paths and public transport.
How much should be charged?
Prices varies depending on day and time e.g. higher chargers for peak periods.
$10 for each trip per day into the city.
Planning for the unplanned - proactive responses to rail disruptions
Session Details
Room: Portico
Format: Presentation and discussion
Host name: Brendon Perder
Your name: Lisa Fu

How to manage unplanned disruptions
With planned disruptions, we know to put the message out in advance and properly inform travellers. Unplanned is a different case.
Buses play a key role, but in the bigger picture, what are some other services? E.g. car share, uber, bikes etc.
There is no reserve (like ambulances and emergency services have) of vehicles that the rail service can pull from.
Melbourne is subdivided into 4 regions for buses, and operators are based generally in the outer suburbs. It can take a while for them to get buses down to disrupted locations, and especially longer when needing to go to the CBD.
There is a stigma around rail replacements
London - when there is a rail disruption, most movement is replaced by the surface transport, there is not enough awareness of alternative transport in melb.
Social media information on parallel modes of public transport, can get the message out on alternative existing routes
So that travellers can plan for their affected journey
But it’s also about dealing with the disrupted commuter
Giving people a choice or a heads up so that they can prepare
Discussion:
There are two categories: people about to use the service; people already using the service (on-board)
For people already using the service, there are welfare messages, and things to take note of such as whether they have enough water.
Faults are often sudden. It’s important to distinguish between a delay or a fault.
Bus replacements have added another 45 minutes onto journeys
We need some actual viable alternatives
Getting people to working/operational parts of the network, instead of running along the train line section that is affected
Planning can group disruptions, so that they are condensed into one period of time, instead of scattered throughout. This happens now.
There is such a small window to do works e.g. welding
This winds up affecting everyone
Speed restrictions are put on, and there are 2-5 minute delays all week
If people knew about the reason for these delays, they might be more tolerant
2 min disruption vs. closing the line down for the whole week
Communication needs to be there
Sometimes the information is not allowed to come out
E.g. can’t say that millipedes are on the track, which is causing the shut down of a line.
Why don’t rail agencies declare real information?
Underpromise and overdeliver
Sensitivities - you can’t just announce a fatality
But an announcement that there has been a police request might be better
Or, the track has now become a crime scene
A sense that something more important is going on
Quality of info is often poor
There needs to be an ‘unplanned plan’ for every station
A poor alternative is better than no alternative
Multimodal maps at every station, with indicators of ‘you are here’, especially at unstaffed stations
Turn outs are 1-2% of the network; but they are 25% of the maintenance budget
During a disruption, when you are on a service, honest communication from the driver is appreciated, as well as making sure there is frequent information over a longer period
London - there is a driver standard that an announcement needs to be made no longer than 30 seconds after a disruption has happened
They let people know something is actively being done
People’s perception of time, especially in a tunnel can be skewed. 1 minute can feel like 5 minutes
An authoritative voice, like one from the train driver helps
Perhaps announcement training for drivers so that they are able to deliver information that is appropriate for passengers
This is fundamentally a human issue
The Female City
Session Details
Room: Supper
Format: Presentation and discussion
No. of attendees: 22
Hosts names: Zoe Condliffe and Anthony Aisenberg
Scribe: Sarah Roberts

Free to be, female city and making spaces- What we don't know
- The Right To Night is a digital mapping tool to show the places women find safe or not in the city.
- 1 in 3 women don’t feel safe in the city, 1 in 4 don’t feel safe on PT.
- Women are not surprised by this stat but men are
- Data in Australia is just as bad as other cities that you would perceive would be worse.
- Improving this for women would improve it for other people
- We currently don’t know what is going on
- Want to make this visible
How can we improve this?
Women have the right to participate in society and if they don’t feel safe we need to understand this and fix this. Women experience situations differently.
- Create a platform where people can express their experiences. Use data to advocate change, target of 350 women.
- The project was a Co-designed tool with women participants.
- Software- have a map, you can drop a pin (happy and sad) and then tell your story. Incorporated emoji’s with this, can map in the moment or at home. These emoji’s are more engaging. This can bring out different locations.
How does it work?
- Choose the time of day, important to distinguish between these.
- Free spot for writing, so they are able to express more.
Things to consider
80% of rapes are not reported, this is a safe way of reporting these.
Spaces close to one another can be perceived very different (fed square and flinders street station)
What would the city look like if it was design based on women?
- On the map 14% of negative places, where PT related.
- 60% of these were to do with rail
- This is perceptions based, not based on real incidents.
- The way you perceive something still changes how you use the service
- More people using PT makes it safer
- Women are changing the way they use spaces and the city, because they are women.
If we can change this, we will see a change in how women participate in society. This data changes the way you perceive how women actually see travel around the city. Men don’t view it this way and are surprised to find out.
The next step, needs to see how we will help to fix this problem.
A meeting will be held on how Flinders street station can be redesigned with this in mind.
- Metro is also being spoken to.
- We need to understand how women behave and how the current safety precautions might not be suitable (the red button on trains is an example of this)
CrowdSpot
CrowdSpot, is a website that shows this information visualised.
There is also a slider version of the data visualisation, where you can see the happy spots in relation to the sad spots.
How can you turn this into action?
- This was a trial, but it has started conversations and media interest.
- Run a design thinking workshop, to reimagine the city
- Talk to metro and police
- Run a trial in Sydney
- How to take the learnings and turn the concept into a scalable platform that can be taken to other countries.
How could this data be useful to us?
- Make sure that these things are tested and are useful. How can we make bad spaces better?
Are there other ways I can make myself safe?
- Police officer
- Phone apps
- A way to alert those around you that you feel unsafe.
- Use this data to make better place making.
Would you do this in Bendigo (smaller cities) or Casey?
- The demographics and cultures are also different.
- Make the tool scalable but localised.
Can you relate these perceptions to where criminal activity actually is?
- Use police reports- a lot of incidents don’t get reported.
- The expectations from different places is also different.
- People are more likely to report sad experiences. The happy places exist so it doesn’t appear overly negative.
- Female bike experience could also use this type of study.
Testing and Trialling Temporary Bicycle Infrastructure
Session Details
Room: Regents
Format: Discussion
Hosts names: Rebecca Sims and Cavaina Baiton (Transport for Victoria)
Scribe: Samithree Rajapaksha
Discussion on how beneficial it is to assess the suitability and performance of bicycle infrastructure.
The most critical issue in implementing such test drive is the safety of the cyclist due to the huge number of crash records related to cyclists.
Discussion about the ongoing safety issues for cyclist, such as
Safety issues when approaching an intersection
Speedy cars
Smaller cycle lanes
Discussion about the how can they implement a segmentation procedure to list down which suburbs might be safer for cyclists.
Discussion about the barriers to implement trial infrastructures for bicycles.
Lack of advocacy.
Funding
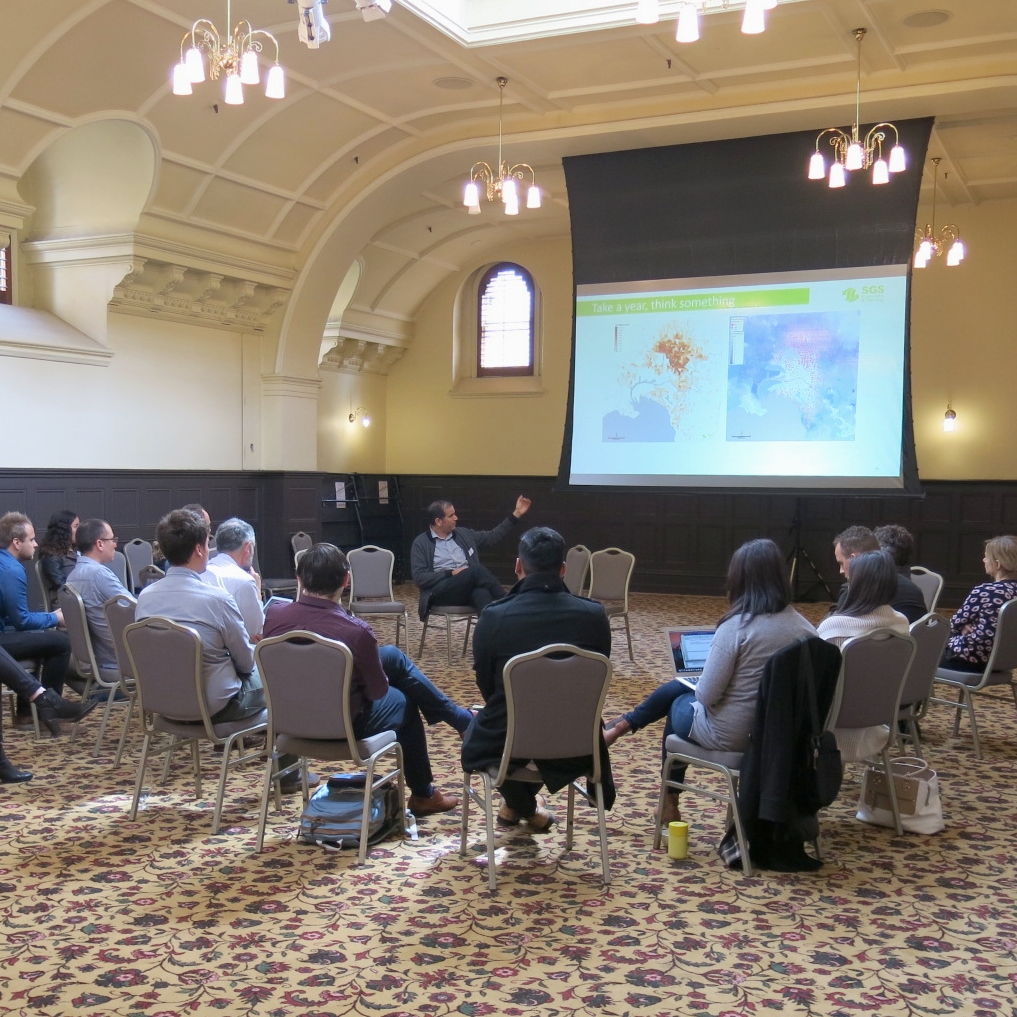
When the Bike Beats the Train
Session Details
Room: Supper
Format: Presentation & Discussion
No. of attendees: 16
Host name: Armando Mazzei (SGS Economics & Planning)
Scribe: Matthew Diemer
What's it about?
Inspired by Ride to Work day to better visualise data of cycling usage:
Where are people coming from when they ride to work?
How do the different neighbourhoods compare to each other?
Data shows that after 6km distance to work, riding numbers begin to fall
High Quality Infrastructure is key to increasing ridership
What’s changed?
Evolution from Industrial Economy to Knowledge Economy means clustering of businesses, people are more important than it has been historically
Driving a car in a clustered economy is more difficult because land uses are less spread out and distances between destinations are shorter, making walking and cycling more efficient options
The private automobile as a method of travel to work in the City of Melbourne has showed a decrease of 10% over the past 10 years
Melbourne’s far reaching train and tram systems make PT a more viable option compared to other Australian cities. But PT is overcrowded, making cycling a more convenient option for people in the CBD and inner suburbs.
Displayed maps that showed how cycling access expands the amount of jobs you can reach within 45 minutes even more than the PT network alone and in some cases cycling allows you to access more jobs in 45 minutes than PT
The economy is shaping our cities and therefore our transport choices
Some rationale can be utilised to identify the areas where riding is likely to happen based on economic development (i.e. urban renewal projects such as Fishermans Bend will likely create opportunities for significant new cycling numbers if high quality infrastructure is built)
Difficult at the moment to accurately compare cycling with PT because currently only use cycling access on street network, compared to data that might show cyclist preference to use paths that might take longer time but offer a safer environment
Last Mile Solutions
Session Details
Room: Portico
Format: Presentation and Discussion
No. of attendees: 15
Host name: Brendon Perder
Scribe: Lisa Fu
How do we move people from car to PT?
What are alternative modes or ways to get from A to B
Buses are a feeder
E.g. rotorua - there are clockwise & anti-clockwise buses
What really constitutes demand responsive?
- E.g. VIC, tele buses in the 80s
Outer suburbs
Fixed route
Roams to other areas when it needed to and people pay a little extra
Pioneer of demand responsive
E.g. Gowanbrae - runs to a patch on a fixed route, then detours within the patch. It carries not many people but it is a place where there needs to be this service
What role do buses play?
E.g. Flexiride service in Woodend and Gisbourne
- Provided an important rail station link. E.g. VIC Yarrawonga - buses replaced taxis near border then they rolled out DRS
- Ptv trial in regional areas with bus and bike integration
- Doesn't always have to be a taxi for last mile, usage is low in Melbourne
Address unsustainable transport patterns in suburban Melbourne
Session Details
Room: Yarra
Format: Presentation and workshop
No. of attendees: 23
Host name: Bridget Spencer
Scribe: Sarah Roberts

We have an unsustainable transport system that needs to be addressed
Set in Casey
- 59% population increase by 2045
- We are behind in infrastructure
- This has an impact on services
- 83% car dominated
- Average household does 10 trips a day, 83% in car.
How will we accommodate for this?
By changing travel behaviour
Auto dependence caused social exclusion
- Might not have access to PT, can’t walk to services, time spent commuting and cost (this will get worse)
- Increase health problems. People have a lack of essential services- this includes no access to healthy food.
- Raise in oil costs
What do we want to achieve?
- A 20 minute neighbourhood- have walking access to everything that you need. The community also wants these changes to happen.
- Promotes sustainable transport modes.
- Adopt smart city transport plan.
2017 current situation
- 85% car used, 5% PT, ineffective bus network
Increasing car infrastructure will not solve these problems, we need to change travel behaviour.
What should we prioritise to do this?
- Infrastructure, financial incentives (less incentive to use the car), improve perceived safety, personalised travel planning, faster travel, convenience?
Workshop, what should we actually prioritise?
- Brief- best ways to tackle automobile dependence
- What should be prioritised
- Let’s workshop our ideas to come up with innovative and effective solutions
Group 1
- Building density housing- suburbs are designed around cars.
- Footpaths are good, need more of these.
- Fast cars and trucks going past you whilst walking and riding is scary.
- Could utilise buses more, trip to train station
- Roads designed to get through the suburbs faster.
- Walking along busy roads are boring, nothing to see, no trees, health issue
Group 2
- Free shuttle buses, higher frequencies
Group 3
- Improve marketing of PT, people don’t know about them
- Involve other business, incentives
- Parking more expensive
- Improve transit to station, more direct, bike paths, increase parking at station/ increase ride sharing.
- Increase local employment
Group 4
- Low density housing, causes bad public transport
Group 5
- Regional public transport solution
- Move away from park and ride
- Transport connections, trip training, local jobs, stitching together old town and new town development
Group 6
- Inform public on transport planning- educate people on what is needed before money is spent
- Controlled planned not reactive planning- close access to the transport network
Group 7
- Need buses to cater for these areas.
- Get increase density along the bus routes. Bus play a bigger role